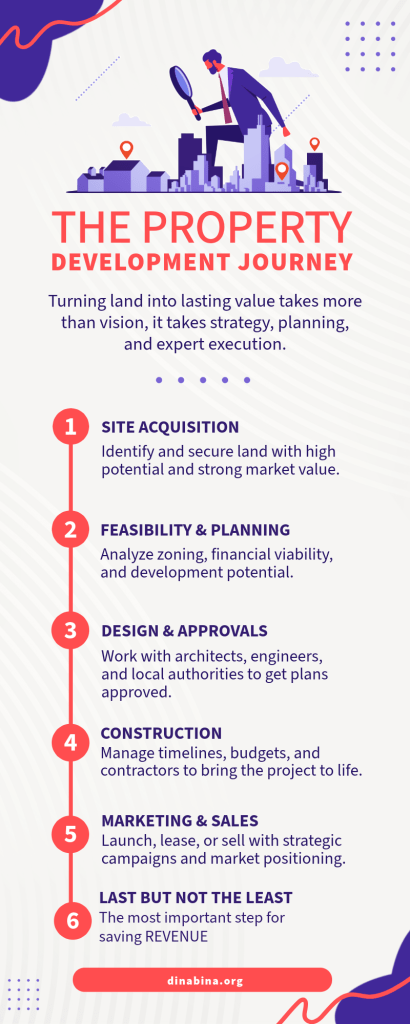
Introduction
Most facility managers don’t know their infrastructure is bankrupt until it’s too late.
They walk into Monday morning believing operations are humming along. By noon, a critical system fails in a city where they don’t have coverage. The email trail explodes. Executives start asking uncomfortable questions. The technician they called isn’t certified for that equipment. The spare parts are somewhere in a drawer, documented only in someone’s memory.
This isn’t incompetence. This is what happens when operational complexity outpaces management systems.
Consider two real scenarios that play out every week in enterprises across Asia, Europe, and North America: one facility manager, same company, one city versus five cities. The premise seems simple—same equipment, same procedures, different scope. But the execution reveals something brutal: complexity doesn’t scale linearly. It explodes.
The cost of this explosion isn’t always visible. It doesn’t show up as a single catastrophic failure. It accumulates—missed maintenance windows, forgotten schedules, equipment running to failure, emergency repairs at 2 AM, technicians burning out, customer complaints, regulatory violations, and insurance premiums climbing each quarter.
This is the hidden economy of maintenance infrastructure failure.
Section 1: The Hidden Cost of Ignoring Infrastructure at Scale
When Systems Break, Profitability Breaks First
The typical facility manager operating a single location with manual processes spends 4 hours daily on administrative tasks: updating spreadsheets, coordinating with technicians via phone calls, tracking maintenance schedules in notebooks or email inboxes, managing spare parts inventory by memory, and generating monthly reports by hand.
Four hours. Every single day. That’s 1,000 hours per year—equivalent to half an employee’s full-time capacity—consumed by desk work that produces zero operational value.
But the administrative burden is just the visible surface. The real cost emerges in system reliability.
Facilities operating without formalized maintenance management systems experience equipment failure rates around 35%. This means that one in three maintenance interventions results in unexpected downtime, production delays, customer dissatisfaction, and cascading failures across interdependent systems. ijcsrr
A single manufacturing facility experiencing 800 hours of unplanned downtime annually incurs losses ranging from $260,000 to $ 500,000 per hour during active disruptions. For a mid-sized operation, this translates to $208–$400 million in annual opportunity costs—money that evaporates not from mistakes, but from reactive, chaotic infrastructure management.
The financial mathematics are inescapable: facilities scaling from one to five cities without upgrading their maintenance infrastructure don’t merely multiply their problems. They compound them.
The Scaling Penalty: Why More Locations = More Failures
Consider the facility manager’s coordination burden across five cities. They must now:
- Ensure technicians in all locations follow the same maintenance protocols despite local variations in equipment, climate, regulations, and workforce training levels
- Track asset inventories across geographically dispersed locations without centralized visibility
- Schedule preventive maintenance across time zones and business hours for locations they may never visit
- Respond to emergencies in locations where they have no local presence or deep equipment knowledge
- Maintain compliance documentation across five separate facilities operating under potentially different standards
This is why scaling frequently produces not incremental growth, but exponential chaos. A facility manager with consistent processes and centralized oversight in one city becomes a coordinator managing fragmented, inconsistent operations across five cities—each with different failure patterns, staffing expertise, vendor relationships, and risk profiles.
Equipment failure rates don’t stay at 35%. They climb. Some facilities experience failure rates exceeding 40-50% when scaling without proper infrastructure investment. oxmaint
Section 2: Breakdown Maintenance vs. Preventive Strategy—The Strategic Difference
What Breakdown Maintenance Actually Means
“Breakdown maintenance” sounds technical, but the practical reality is simpler: you wait for equipment to fail, then you fix it.
No planning. No forecasting. No scheduled downtime windows. Just reaction—constant, expensive, demoralizing reaction.
The business logic seems appealing on a spreadsheet. You don’t invest in maintenance unless something breaks. No unnecessary work. No predictive maintenance algorithms you don’t understand. No expensive software licenses. Just pragmatic, lean operations.
Until the first critical failure occurs during peak business hours.
At that moment, the economics flip. Emergency repairs cost 3-5 times as much as planned maintenance. Your team works overtime. Spare parts arrive at premium pricing. Production halts. Customers call. Revenue stops flowing.worktrek
And here’s what facility managers discover too late: when operating across multiple locations, breakdown maintenance doesn’t just cost more per incident—it creates systemic organizational risk. When one facility and one critical system fail, the impact is localized. When you have five facilities and your technician resources are already stretched, the same failure cascades across your network due to a lack of bench capacity.
Breakdown maintenance in a distributed environment doesn’t just create cost; it creates vulnerability at scale.
Preventive Maintenance: Building Strategic Infrastructure, Not Just Fixing Things
Preventive maintenance reverses this logic. Instead of reacting to failures, you forecast them.
Regular inspections identify degradation before catastrophic failure. Maintenance is scheduled during planned downtime windows. Spare parts are ordered at standard pricing, reducing inventory carrying costs. Technician time is allocated efficiently, reducing overtime premiums. Equipment operates closer to design specifications, extending asset lifespan.
The financial outcome: preventive maintenance reduces overall maintenance costs by 12–18% compared to reactive approaches. uptimeai
But this statistic hides the strategic advantage. With preventive maintenance, facility managers regain control over their operational calendar. Maintenance doesn’t interrupt production—it’s integrated into production planning. Equipment doesn’t fail unpredictably—degradation patterns are known and managed.
This control becomes exponentially more valuable at scale. A facility manager coordinating preventive maintenance across five locations can predict resource needs three months in advance. They can negotiate bulk pricing with vendors. They can cross-train technicians efficiently. They can build vendor relationships based on consistent, predictable demand rather than emergency chaos.
Preventive maintenance transforms facility management from crisis response into strategic operations planning.
Section 3: Real-World Scenarios Across Industries
Manufacturing: When Downtime Compounds Across the Network
A mid-sized automotive parts manufacturer operates facilities in five cities, each producing components for different vehicle models. Without centralized maintenance management, each location operated independently, with technicians responding to breakdowns as they occurred.

Results after 18 months of this structure:
- Facility A (City 1): Equipment operated on breakdown maintenance. Unplanned downtime averaged 12 hours weekly. An unexpected conveyor belt failure during a critical production run delayed 500 units and triggered customer penalties totaling ₹4.2 lakh.
- Facility B (City 2): Same situation. A hydraulic system failure in a press led to a three-day shutdown, affecting inventory commitments and requiring emergency overtime.
- Facility C (City 3): Critical bearing failure in a spindle caused cascading damage to adjacent equipment, extending repair time from 8 hours to 48 hours.
- Facilities D & E (Cities 4 & 5): Smaller locations, but similar patterns—frequent, unpredictable failures creating constant scheduling chaos.
Total impact across five facilities over 18 months:
- 47 hours of unplanned downtime per week
- Estimated revenue loss: ₹2.8 crore+
- Emergency repair costs: 4-5x higher than planned maintenance would have been
- Customer complaints: 34 recorded complaints related to delivery delays
- Employee burnout: 12% technician turnover due to overtime stress
The manufacturer implemented centralized preventive maintenance:
- Systematic inspection schedules across all five facilities
- Centralized spare parts inventory managed through a CMMS
- Technician cross-training to enable inter-facility support
- Vendor partnerships based on predictive maintenance data
Results after 12 months of preventive maintenance:
- Unplanned downtime has been reduced to 3 hours per week (across all five facilities)
- The equipment failure rate dropped from 38% to 7%
- Maintenance costs decreased by 19% despite managing more equipment
- Revenue recovery: ₹1.4+ crore in recovered production capacity
- Customer complaints: 2 recorded complaints (94% reduction)
- Technician retention: 0% turnover in the subsequent 12 months
Facilities Management: Administrative Burden as Hidden Loss
A commercial real estate company managing five office complexes across major cities faced a persistent challenge: their facility managers could not coordinate effectively across locations. Each manager maintained separate maintenance schedules, separate vendor lists, and separate spare parts inventories. When a critical HVAC issue occurred in City 3, the manager in City 1 couldn’t quickly assess whether identical equipment elsewhere had experienced similar issues.
The administrative burden was staggering: 18+ hours per week per facility manager spent on coordination, scheduling, and documentation.
A single preventive maintenance software system was implemented:
- Centralized asset register tracking all HVAC, electrical, plumbing, elevator, and security systems across all five facilities
- Automated work order generation triggered by maintenance schedules
- Real-time visibility into technician location and availability
- Automated vendor communication and invoice tracking
Results:
- Administrative time reduced from 18 hours to 3 hours weekly per facility manager
- Response time to emergency maintenance: reduced from 6 hours average to 45 minutes
- Paperless operations reduced printing and documentation costs by 87%
- Predictable maintenance budgeting enabled 18-month cost forecast accuracy
- Tenant satisfaction scores increased from 6.2/10 to 8.7/10 due to faster response times
Small Businesses & Startups: Scaling Breaks Infrastructure First
An Indian logistics startup operating in three cities initially handled facility maintenance through an ad hoc approach—a facility manager called vendors directly, tracked maintenance schedules in a notebook, and managed spare parts requests via WhatsApp.
As the company expanded to five cities within 18 months, the informal system collapsed:
- The facility manager couldn’t keep track of maintenance dates across five locations
- Critical fire safety equipment inspections were missed, exposing the company to regulatory violations
- Backup generator failures went undetected until they failed during peak operations, causing a 14-hour system outage
- Spare parts inventory had no organization—emergency orders cost 2-3x normal pricing
The company invested in a cloud-based CMMS:
- All maintenance schedules are automated
- Compliance checklist tracking ensured regulatory adherence
- Predictive alerts prevented equipment failures before they occurred
- Inventory management reduced spare parts carrying costs by 34%
The ROI was recovered in 6 months through downtime reduction, and the system scaled with the company, now operating 12 locations with the same administrative overhead that previously managed 3.
Section 4: Understanding Your Current State—The Diagnostic Framework
Are You Operating in “Breakdown Mode”?
Warning signs your facility is running on breakdown maintenance:
- Your facility manager spends 4+ hours daily on administrative tasks that should take 15 minutes with proper systems
- Maintenance schedules exist only in someone’s head or in fragmented spreadsheets
- When asked about equipment failure rates, you estimate rather than measure
- Emergency repairs happen more frequently than planned maintenance
- Spare parts inventory is chaotic—you discover parts you need are missing only when equipment fails
- Technician teams operate independently, duplicating work and missing cross-facility learning opportunities
- Compliance documentation exists scattered across email inboxes, filing cabinets, and individual laptops
- Scaling to new locations feels terrifying because you can’t replicate your processes consistently
- Customer complaints or regulatory findings include maintenance-related issues
If three or more of these describe your current state, your infrastructure is bankruptcy waiting to happen.

The Cost of Staying in Breakdown Mode—Calculate Your Hidden Burden
Use this framework to quantify your actual maintenance cost burden:
Direct costs:
- Planned maintenance labor and parts
- Emergency repair labor premiums (typically 2-3x normal rates)
- Emergency spare parts ordering premiums
- Overtime costs
Indirect costs:
- Production downtime (revenue loss per hour × hours of downtime)
- Quality degradation (scrap rates, rework)
- Customer penalties or satisfaction impact
- Regulatory compliance violations
- Equipment lifespan reduction (replacing equipment early due to deferred maintenance)
Organizational costs:
- Technician turnover due to constant firefighting
- Facility manager burnout and reduced strategic contribution
- Fragmented knowledge (if one key technician leaves, critical maintenance knowledge leaves with them)
For a manufacturing facility with 800 hours of unplanned downtime annually, this framework typically reveals ₹2-₹10 crore in hidden costs that don’t appear in maintenance budgets but do appear on profit-and-loss statements.
Section 5: Benefits Beyond Cost Savings—The Strategic Transformation
Reliability Creates Predictability
When equipment fails predictably (or doesn’t fail because you’re managing it proactively), facility management transforms from chaos response to strategic planning.
Production scheduling becomes reliable—you can commit to customer delivery dates knowing your equipment will be available. Technician capacity planning becomes rational—you can forecast resource needs instead of reacting to emergencies. Vendor relationships become partnerships—you’re generating predictable, consistent demand instead of erratic emergency orders.
This shift isn’t just financial. It’s organizational.

Decision-Making Clarity Through Data
Manual maintenance operations produce stories, not data. “That HVAC unit seemed to be having issues last month,” a facility manager might say.
Preventive maintenance systems produce traceable, quantifiable records:
- Equipment X experienced a 0.2-degree daily temperature increase over six weeks before a critical failure would have occurred
- Filter clogs were detected at 75% capacity before the productivity impact
- Bearing degradation followed a predictable pattern, allowing replacement 14 days before catastrophic failure
- Maintenance was performed, data recorded, outcome measured
Over time, this data enables increasingly sophisticated decisions:
- Which equipment should be replaced versus repaired?
- Where should technician training focus to maximize prevention?
- Which vendors consistently deliver parts on time, enabling better spare parts decision-making?
- Which locations have equipment reliability issues suggesting design or installation problems?
Data transforms facility management from art to science.
Organizational Learning and Resilience
When facility management is ad-hoc, knowledge is fragmented. When one technician leaves, critical institutional knowledge walks out the door. When a failure occurs, the response is unique rather than systematic—each crisis triggers a new problem-solving cycle with no institutional learning.
Formalized maintenance systems create organizational memory. Every failure is documented, analyzed, and prevented from recurring. Every technician can access the complete history of every asset, enabling consistent decision-making. Every location operates from the same playbook, reducing variation and compounding learning across sites.
This institutional resilience becomes your competitive advantage at scale.
Section 6: The Honest Limitations—When Maintenance Strategy Fails
Preventive Maintenance: When “Preventing” Becomes Wasteful
Preventive maintenance has a shadow side that most vendors don’t mention: 30% of preventive maintenance tasks are unnecessary.
A facility manager decides that a bearing should be replaced every 18 months as preventive maintenance. The bearing is systematically replaced, often before its useful life has expired. Over five years, these results in multiple unnecessary replacements—parts discarded in good condition, labor spent removing functioning equipment, and potential risk introduced by unnecessary service interventions.
This is the preventive maintenance trap: when fixed schedules are applied to variable failure modes, you over-maintain.
The antidote is sophisticated condition monitoring (toward predictive maintenance), but it introduces complexity and cost that aren’t always justified for low-risk or inexpensive equipment.
Scaling Introduces Coordination Complexity
Moving from one city to five cities introduces coordination challenges that aren’t merely operational—they’re human and organizational.
When you implement a centralized CMMS, you’re asking five different facility managers, potentially from different regional backgrounds, with different maintenance philosophies, to operate from identical playbooks. This creates friction:
- Local facility managers may feel they’re losing autonomy
- Work styles that worked in isolation now create inefficiencies with coordinated systems
- Organizational politics can interfere with standardized processes
- Cultural resistance to centralization is underestimated
Data Quality is Foundational
Garbage in, garbage out: preventive maintenance systems are only as effective as the data they operate on.
If inspections are performed perfunctorily, if maintenance records are incomplete, if equipment specifications are inaccurate, the entire system produces poor decisions.
Many facilities implement CMMS systems and then discover that their baseline data is inadequate—they don’t actually know the specifications of their equipment, they haven’t documented maintenance history, and they don’t have accurate asset registers.
Implementing a system without first establishing data quality creates the illusion of improvement while actual performance stagnates.
Section 7: Modern Insights & How Digital Systems Change the Game

IoT Sensors Enable Real-Time Predictive Capability
The maintenance landscape has shifted fundamentally in the past 24 months.
Historical preventive maintenance relied on fixed schedules—oil changes every 500 hours, bearing replacements every 18 months, and filter changes every quarter. This approach assumes uniform operating conditions, but reality is messier. Equipment operates under variable loads, variable temperatures, and variable operating hours.
Modern IoT-enabled maintenance systems use real-time sensor data to monitor actual equipment condition:
- Vibration sensors detect bearing degradation earlier than traditional inspections
- Temperature sensors identify equipment operating outside optimal ranges
- Acoustic sensors detect early-stage failure patterns through sound signature analysis
- Oil analysis sensors measure degradation chemistry in hydraulic and lubrication systems
Research demonstrates that acoustic-based predictive maintenance identifies hazards in motorcar systems with 87% accuracy, compared with 62% for traditional vibration analysis. Journal.esrgroups
These systems provide 5-7 days’ advance notice for critical failures—enough time to schedule maintenance during planned downtime, order parts at normal pricing, and avoid emergency escalation.
Machine Learning Enables Organizational Learning at Scale
IoT sensors produce data. Machine learning transforms data into intelligence.
The machinery? Learn patterns from historical equipment performance. Detect anomalies that precede failures by comparing current sensor readings to baseline patterns. Predict remaining useful life (RUL) for each asset based on degradation trajectories.
Over time, this learning becomes increasingly sophisticated:
- The system learns that this particular equipment fails most frequently at ambient temperatures above 38°C
- The system learns that this bearing typically fails 14 days after detecting specific vibration patterns
- The system learns that Vendor A’s spare parts last 12% longer than Vendor B’s equivalent parts
Organizations implementing ML-enabled predictive maintenance achieve 10:1 to 30:1 ROI within 12-18 months.
Centralized Visibility Enables Distributed Decision-Making
The paradox of modern facility management at scale: centralization produces better distributed decision-making.
When all five facility locations operate from a centralized CMMS with real-time visibility, local facility managers have access to:
- Complete asset history across all locations
- Vendor performance data enabling better procurement decisions
- Maintenance best practices that have proven effective in other locations
- Early warning of systemic issues (if Equipment Type X is failing across multiple locations, a design or installation issue is likely)
- Spare parts availability across the network (if City 1 has a critical spare part that City 4 needs, the system enables rapid coordination)
Section 8: Future Direction—Where Maintenance Strategy is Heading
Autonomous Maintenance: Equipment That Manages Itself
The cutting edge of predictive maintenance is approaching autonomous capability.
Imagine equipment that monitors its own health, schedules its own maintenance appointments, orders its own spare parts when degradation is detected, and communicates maintenance needs to technicians who arrive pre-planned with the exact parts and tools required.
This isn’t science fiction. Siemens, GE, and other industrial equipment manufacturers are embedding these capabilities into new equipment. The economics are powerful—maintenance becomes increasingly predictive, less reactive, less dependent on technician expertise, and increasingly data-driven.
For facility managers planning 5-10 years ahead, this trajectory matters: new equipment investments should prioritize IoT-ready, connected systems that enable autonomous health monitoring.
Augmented Reality for Technician Capability
Another emerging reality: augmented reality (AR) systems that overlay maintenance procedures, schematics, and historical maintenance data directly onto equipment.
A technician wearing AR glasses approaches a piece of equipment, and the system displays:
- Complete maintenance history of that specific asset
- Step-by-step procedure for the required maintenance task
- Real-time comparison of current readings to baseline values
- Parts inventory and availability information
- Video call capability to remote experts if complications arise
This capability doesn’t require technicians to carry years of accumulated knowledge—AR systems democratize expertise across the workforce.
Sustainability and ESG: Maintenance as Environmental Responsibility
Preventive maintenance has an overlooked benefit: it’s fundamentally more sustainable than reactive maintenance.
When equipment is maintained proactively, it operates closer to design specifications and consumes less energy. When equipment fails and requires emergency replacement, the environmental cost of manufacturing new equipment plus recycling old equipment is massive.
Facilities that implement comprehensive preventive maintenance programs report 5-15% reductions in energy consumption as equipment operates at optimal efficiency.
As regulatory pressure around Environmental, Social, and Governance (ESG) standards increases, facility managers will increasingly need to demonstrate that their maintenance practices reduce environmental impact.
Section 9: Transformation Architecture—Building the System
The Foundation: Asset Register and Data Audit
Before implementing any technology, you must understand what you’re maintaining.
This sounds obvious. Most facilities don’t do it.
Start with a complete asset audit:
- Photograph every major piece of equipment
- Document specifications, purchase dates, warranty periods, vendor contacts
- Record current condition and known issues
- Identify equipment that’s critical to operations versus non-critical
- Locate maintenance manuals and establish a digital archive
This audit typically uncovers surprising facts: equipment operating past warranty periods, critical spares missing, manufacturer contacts unknown, maintenance procedures undocumented.
Timeline: 4-8 weeks for a five-location facility
Phase 1: Baseline Establishment (Months 1-3)
Implement basic preventive maintenance workflows:
- Establish maintenance schedules for each piece of equipment based on manufacturer recommendations
- Create standard procedures for each maintenance task
- Designate responsible staff at each location
- Implement basic work order system (can start with Excel before investing in software)
- Begin documenting all maintenance performed with date, person, and outcome
Expected outcome: Equipment failure rates begin declining from 35% toward 15-20% range
Phase 2: Technology Implementation (Months 3-6)
Introduce centralized CMMS software:
- Migrate maintenance schedules into the system
- Establish vendor and spare parts database
- Configure automated work order generation
- Set up mobile applications for technician field work
- Implement reporting and KPI tracking
Expected outcome: Administrative burden reduced by 75%, visibility across all locations established
Phase 3: Predictive Capability (Months 6-12)
Layer in condition monitoring:
- Install IoT sensors on critical equipment
- Integrate sensor data with CMMS
- Develop data dashboards for facility managers
- Begin generating predictive maintenance alerts
- Train staff on interpreting sensor data
Expected outcome: Equipment failure rates approach single digits (5-8%), maintenance costs reduced 15-20% from baseline
Section 10: The Transformation Story—Real Learning
First-Hand Insight: When Scaling Exposed Everything
An Indian facility management company operating in one city expanded to managing facilities in three new cities. The founder believed scaling would be straightforward—same processes, more locations.
Six months into multi-city operations, the reality was different.
City 1’s facility manager used a specific maintenance vendor for HVAC work. City 2’s facility manager used a different vendor with different pricing, response times, and quality standards. City 3’s facility manager was coordinating with a third vendor.
When a critical HVAC failure occurred simultaneously in City 1 and City 2, the company discovered they had no visibility into which vendors could respond to both locations, which spare parts were available where, and how to coordinate technician resources across cities.
An emergency implementation of a CMMS solved immediate chaos, but the real lesson was structural: growth without infrastructure synchronization leads to fragmentation that becomes increasingly expensive to reconcile.
The company learned that scaling isn’t about rolling out existing processes—it’s about building systems that make process consistency automatic rather than aspirational.
Indian Context Learning: Tier-2 & Tier-3 City Realities
[Real Anonymous Story—Tier-2 City Facility Transformation]
A mid-sized manufacturing company in Tier-2 city (anonymously) faced challenges implementing preventive maintenance because:
- Skill gaps: Available technicians lacked training on modern equipment diagnostics
- Vendor consolidation: Limited local vendors meant less competitive pricing and longer response times
- Cost sensitivity: Upfront investment in CMMS was seen as an expenditure rather than an operational infrastructure
- Infrastructure variability: Power outages and internet connectivity disruptions made real-time monitoring unreliable
The transformation approach was adaptive:
- Local training: Invested in certifying local technicians rather than importing expertise
- Vendor partnerships: Built relationships with vendors outside the immediate city, establishing service level agreements
- Phased investment: Started with spreadsheet-based scheduling before implementing software
- Hybrid monitoring: Combined real-time monitoring, where infrastructure supported it with manual inspections for critical assets, where connectivity was unreliable
Result after 18 months:
- Equipment failure rate reduced from 36% to 9%
- Maintenance costs decreased despite increased investment in technician training
- Local technician pool became a competitive advantage—lower labor costs combined with trained capability
- Scalability improved—the company could now expand to additional cities using proven playbook
Key insight: Maintenance transformation in emerging markets requires adapting Western best practices to local infrastructure and economic realities, rather than simply importing processes designed for developed-market conditions.
Section 11: Decision Framework—Is Now the Right Time to Transform?
The Urgency Calculation
Transform immediately if:
- You’ve experienced significant customer complaints related to equipment failures
- Equipment failure rates exceed 20%
- You’re planning to scale to new locations within the next 12 months
- Administrative burden consumes 3+ hours daily for facility management
- Compliance documentation is scattered or incomplete
- You’ve experienced regulatory findings related to maintenance procedures
- Technician burnout is visible (high turnover, quality complaints)
Consider transformation in the next 6 months if:
- Equipment failure rates are between 10-20% (improving but not optimal)
- You’re currently doing preventive maintenance on some equipment but not others
- You have the capacity to invest in change management alongside technology
You have time to plan if:
- Your current system is functioning adequately (< 10% failure rates, controlled costs)
- You’re not planning a significant expansion in the near term
- You have time to implement change thoughtfully rather than reactively
Downtime Costs by Business Size
Large Enterprises: The Million-Dollar Hour
Large enterprises—especially Global 2000 organizations with billion-dollar revenues—face significant financial exposure from downtime stemming from their scale and operational complexity.
Recent industry research highlights how severe these losses can be:
- In the automotive sector, downtime can cost over $2 million per hour, while heavy industry loses tens of millions annually due to unplanned outages.
- For billion-dollar enterprises, estimates place downtime at thousands of dollars per minute, quickly compounding into hundreds of thousands per hour.
- Studies on large enterprises report losses exceeding $1 million per hour during major outages.
- For high-stakes sectors such as finance and healthcare, downtime costs can rise dramatically, surpassing $5 million per hour.
Across industries, the data consistently shows one reality:
as organizations scale, even short periods of unplanned downtime translate into massive financial, operational, and reputational damage.
The following table summarizes key findings for large enterprises:
| Source | Cost per Hour | Cost per Minute | Industry/Sector Notes |
|---|---|---|---|
| Siemens (2024) | $2.3M (automotive), $36,000 (FMCG) | – | Heavy industry: $59 M annually, oil & gas variable |
| CloudSecureTech (2025) | $540,000 | $9,000 | For billion-dollar revenue companies |
| divergeit.com (2024) | >$1 million | – | Exceeds $1 million per hour |
| ITIC (2024) | >$300,000 (90%), $1 M – $ 5 M+ (41%) | – | Includes Mid-sized and large enterprises |
| Splunk & Oxford Economics (2024) | $400 billion annually (9% of profits) | – | Global 2000 companies, various costs |
| clyk.tech (2024) | $540,000, up to $5 million (high-stakes) | $9,000 | High-stakes industries like finance, healthcare |
| Forbes Councils (2024) | $540,000, up to $5 million (higher-risk) | $9,000 | Higher-risk enterprises like finance, healthcare |
| BigPanda (2024) | $1,425,000 | $23,750 | Specific to large enterprises |
| Gartner (2024) | $500,000-$1 M, up to $ 5 M+ | – | Fortune 500, finance/healthcare are the highest |
For CIOs, these figures underscore the need for robust IT governance and investment in high-availability systems. Senior IT Managers must prioritize real-time monitoring and automation tools to detect and mitigate outages and potential issues swiftly, while also focusing on multi-cloud strategies to reduce single points of failure.
Medium-Sized Enterprises: The Hidden Burden
Medium-sized enterprises—typically generating $50 million to $1 billion in revenue—also face serious financial risk from downtime, often at levels that can stall or reverse growth.
Industry research shows the impact is substantial:
- A large majority of mid-sized organizations report downtime costs exceeding $300,000 per hour, with a significant portion experiencing losses ranging from $1 million to well over $5 million per hour during major incidents.
- Earlier benchmarks already placed downtime at hundreds of thousands of dollars per hour, and more recent trends indicate these figures have risen sharply as operations become more digital and interconnected.
- Studies highlight a steep increase in per-minute downtime costs, reflecting growing dependence on always-on systems and real-time operations.
- In sectors such as retail and manufacturing, hourly losses typically range from $200,000 to $500,000, while digital-first businesses face even higher exposure due to their reliance on e-commerce and online platforms.
For mid-sized enterprises, downtime is no longer a temporary inconvenience—it represents a material threat to revenue, customer trust, and long-term competitiveness.
The following table details costs for medium-sized enterprises:
| Source | Cost per Hour | Cost per Minute | Notes |
|---|---|---|---|
| ITIC (2024) | >$300,000 (90%), $1 M-$5 M+ | – | Includes mid-sized enterprises, survey-based |
| Atlassian (n.d.) | $540,000 | $9,000 | Older data, $1 M annual spend on incidents |
| BigPanda (2024) | – | – | 60% increase in cost per minute, no specific figure |
| Gartner (2024) | $200,000-$500,000 | – | Retail, manufacturing, and higher for digital-native firms |
For senior IT managers, these costs underscore the critical importance of proactive maintenance and automated incident response. CIOs are increasingly required to balance cost efficiency with operational resilience, making strategic investments in scalable, resilient technologies that withstand disruption.
Business continuity leaders must factor downtime costs directly into risk assessments, ensuring that recovery time objectives align with the true financial impact of outages. When recovery targets reflect real business exposure, resilience planning shifts from a technical exercise to a strategic priority.
Taken together, this reality strengthens the business case for continued and deliberate investment in resilience strategies—not as optional safeguards, but as essential drivers of stability, trust, and long-term performance.
Small Businesses: Proportionally Devastating
Small businesses, typically with revenues under $50 million, face lower absolute costs but significant relative impacts that threaten survival. CloudSecureTech (2025) estimates wage losses of $0.67 per minute per employee, translating to over $250,000 annually for a 100-employee firm. divergeit.com (2024) reports $427 per minute in losses, with annual losses up to $1 million due to revenue loss and reputational damage. Siemens (2024) notes that SMEs can face up to $150,000 in costs per hour. Gartner (2024) adds that small retail and service businesses lose $50,000 to $100,000 per hour, with e-commerce SMBs facing higher costs due to customer churn.
The following table summarizes small business downtime costs:
| Source | Cost per Hour | Cost per Minute | Notes |
|---|---|---|---|
| CloudSecureTech (2025) | – | $0.67 (wage loss per employee) | Daily cost $10.25/employee, annual >$250,000 for 100 employees |
| divergeit.com | – | $427 | up to $1M/year in lost revenue, intangibles |
| Siemens (2024) | Up to $150,000 | – | Significant for SME, impacts supplier status |
| Gartner (2024) | $50,000-$100,000 | – | Retail, service industry; higher for eCommerce SMBs |
Industry-Specific Impacts
Downtime costs vary widely by industry, reflecting differences in technology dependence and operating models.
- Automotive and heavy industry experience extremely high hourly losses due to tightly coupled production systems and automation.
- Fast-moving consumer goods (FMCG) typically have lower hourly costs because operations are less dependent on real-time IT availability.
- Finance and healthcare can incur multi-million-dollar losses per hour, driven by regulatory penalties, service criticality, and erosion of customer trust.
- Retail e-commerce platforms suffer particularly severe losses during peak seasons, while manufacturing organizations face major financial impact from supply-chain disruptions and production stoppages.
For CIOs, understanding these industry-specific dynamics enables the development of tailored resilience strategies. Financial institutions require near-zero-downtime architectures. Manufacturing environments must integrate IoT and automation to reduce production halts. Retail continuity teams should prioritize scalable failover capabilities to handle traffic surges.
Beyond Financial Costs: Operational and Reputational Impact
The impact of downtime extends far beyond immediate financial loss.
Large enterprises can lose a meaningful portion of annual profits due to downtime when indirect costs—such as idle labor, recovery efforts, and customer churn—are included. Reputational damage is especially severe for smaller organizations, where a single prolonged outage can permanently erode customer trust.
Customer attrition following outages is common, and rebuilding confidence often takes months. For senior IT managers, this reality underscores the importance of service-level agreements that prioritize rapid recovery. CIOs must clearly communicate downtime risk to executive leadership and justify resilience investments. Business continuity teams should incorporate reputation management and customer communication into recovery planning.
Strategies for Mitigation
IT leaders can significantly reduce downtime risk by adopting a combination of the following approaches:
- High-availability architectures with redundancy to ensure continued operation during failures
- Technologies that reduce human error and enable faster recovery, minimizing the most common causes of outages
- Automated monitoring and incident response to detect and resolve issues before they escalate
- Managed services to provide cost-effective expertise for organizations with limited internal resources
- Employee training programs to reduce mistakes and improve response confidence
- Regular recovery exercises to build familiarity, speed, and coordination during incidents
- Routine testing of recovery plans to validate recovery time and recovery point objectives
Implementing several of these measures together can eliminate many common causes of downtime. Low-cost, structured recovery environments can also reduce operational burden on IT teams, allowing them to focus on maintaining production systems and introducing new technologies that drive long-term value.
Conclusion
In 2025, downtime remains a major operational and financial challenge, with estimated costs ranging from approximately $50,000 per hour for small businesses to well over $5 million per hour for large enterprises in high-stakes industries. The wide variation across sectors—such as multi-million-dollar hourly losses in automotive compared to far lower figures in FMCG—underscores the need for industry-specific resilience strategies rather than one-size-fits-all approaches.
Analyst research consistently reinforces the urgency of investing in resilience, particularly for digital-native and e-commerce-driven organizations where availability directly impacts revenue and customer trust. For CIOs, senior IT leaders, IT professionals, and business continuity teams, understanding the true financial impact of downtime is the first step toward building robust, outage-resistant operations.
By prioritizing proactive monitoring, system redundancy, and rapid recovery capabilities, organizations can significantly reduce exposure to downtime risk and protect long-term performance and continuity.
Many organizations are unaware of their actual downtime exposure. Accurately estimating these costs is often the starting point forinformed resilience and investment decisions
The Maintenance Paradox
Growth doesn’t break well-designed systems. Growth exposes systems that were never designed for scale.
When a facility manager in a single city operates manually, systems remain hidden. Breakdowns are managed. Technicians work overtime. Money is spent on emergency repairs. The business absorbs the inefficiency.
When that same company expands to five cities, manual systems don’t scale. Friction emerges. Inconsistency becomes visible. Emergency coordination becomes impossible. The system collapses under the weight it was never designed to carry.
This isn’t a failure of the facility manager. It’s a failure of infrastructure to anticipate growth.
The facility managers who win at scale aren’t necessarily smarter or more experienced. They’ve simply invested in infrastructure—systems, processes, technology—that handles complexity systematically rather than heroically.
Your decision is binary: invest in infrastructure now, or invest in crisis management later.
The math is unambiguous. Infrastructure investment produces 10-30x ROI within 18 months. Crisis management produces unpredictability, burnout, and constant fires.
The question isn’t whether maintenance transformation matters. The question is whether you’ll implement it strategically or whether growth will force you to implement it in crisis mode.
Delegation Techniques That Strengthen Facility Team Performance and Growth
Final Reflection Questions
- If your facility manager got hit by a bus tomorrow, how many critical maintenance procedures exist only in their head?
- What percentage of your maintenance budget is currently spent on emergencies versus planning?
- How confident are you that all five of your locations (if you have them) are following identical procedures for identical equipment?
- What would your business look like if equipment failure rates dropped from 35% to 8% and administrative overhead dropped from 4 hours to 15 minutes daily?
Manual maintenance costs ₹2.8 crore+ annually. Discover why preventive systems reduce failures 80% and save 18-25% on maintenance budgets.
Discover how predictive maintenance scales: The time to build systems is before you need them in crisis mode.
“Together, We Keep It Alive”
Words find meaning when hearts stay connected.
If this reflection reached you, your small act of support keeps the light of shared purpose alive.
Please write to us at dinabinamarigold@gmail.com for an invoice, if required.